Building Optimization Would Save US Schools $2 Billion Annually
This is a two-step process. The first step (planning) incorporates sustainability into the design, reducing the overall baseline of energy…
This is a two-step process. The first step (planning) incorporates sustainability into the design, reducing the overall baseline of energy…
This is a two-step process. The first step (planning) incorporates sustainability into the design, reducing the overall baseline of energy consumption. The second step (management) comes down to how a building is operated. This is best shown through the Sprint to Savings competition ran by Jamie Donovan using building optimization planning and management. This program came from the success of Dunbar High School’s Optimization.
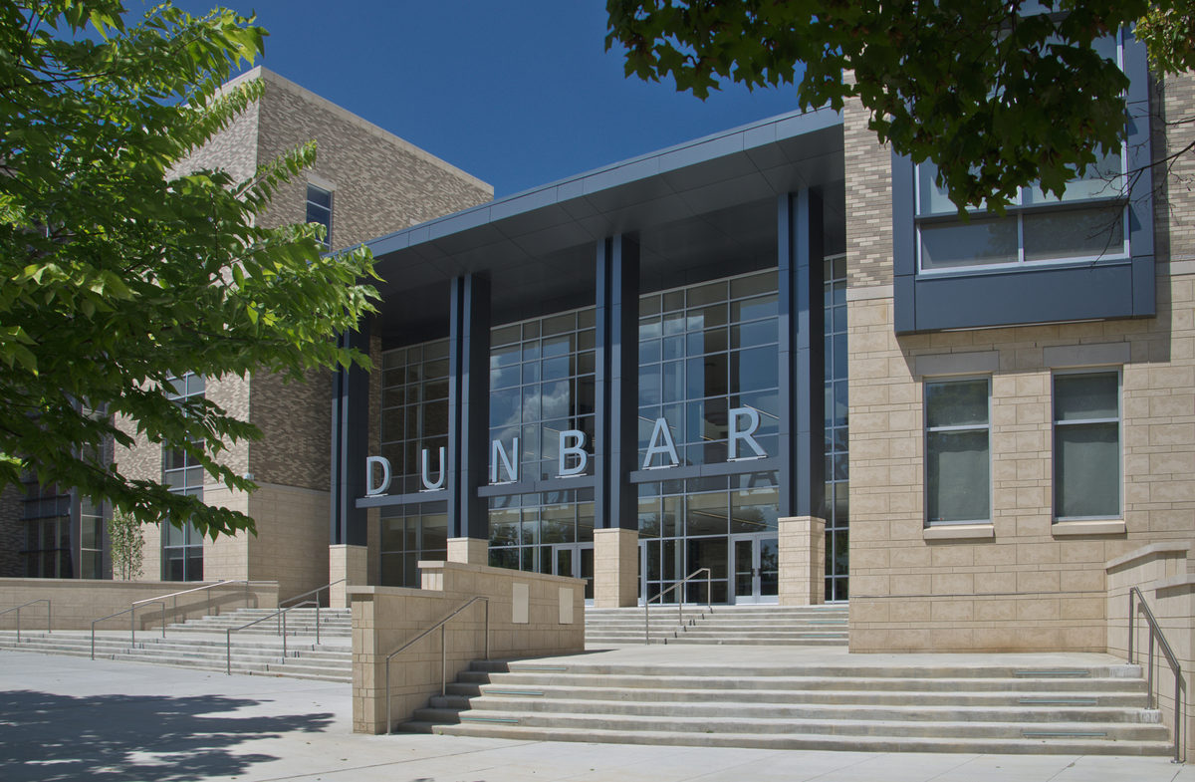
Dunbar High School, which is recognized as The “Greenest School in the World”, is a notable case study. It earned the U.S. Green Building Council’s (USGBC) highest distinction, LEED Platinum certification. Dunbar scored 91 out of a possible 110 points possible for LEED—making it the highest-scoring newly constructed K-12 school in the world!
Dunbar’s new campus raises the bar for sustainable building design and environmental stewardship. Notable enhancements include:
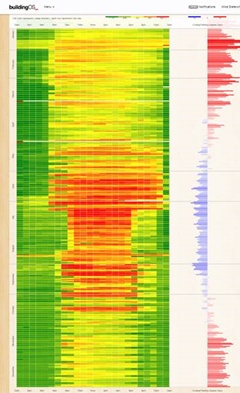
10 months after opening I lead a meeting with Dunbar’s engineer, architect, facilities manager, head administrator, and the owner met to discuss the operational procedure, schedule, and HVAC temperature set points. Decisions generated by this meeting reduced Dunbar’s energy consumption by 40% in the summer and by 20% in the fall, ultimately saving the school an estimated $50,000 in yearly utility costs. The diagram illustrates Dunbar’s HVAC usage before and after the meeting. As seen by the hourglass in the graph to the right. The top of the graph is January and runs to December. The Graph runs midnight to midnight. The green is unoccupied times and the yellow-red when energy use is highest. Scheduling the building around its actual use saved.

This success led the way for the ‘Sprint to Savings’ energy competition challenged participating DCPS schools to reduce
their electricity during the five-week competition period (December 1- January 4). Their performance was compared to a weather normalized baseline period (October 15-November 30). Since the primary goal of the competition is occupant engagement and education, for a fair and effective competition design.
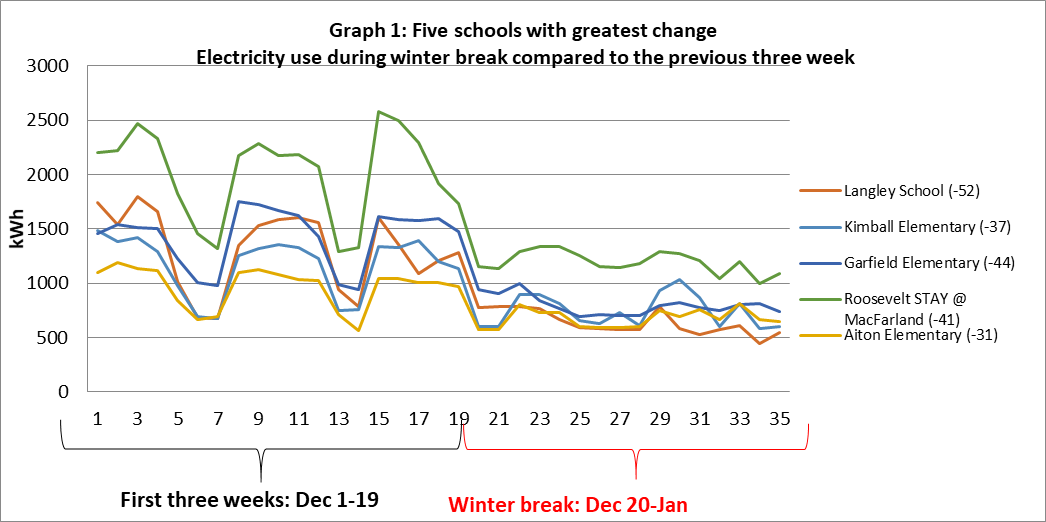
Using data from the competition, we compared the average daily kilowatt hour (kWh) consumption during winter break compared to daily consumption during the first three weeks of December. As a whole, the 25 schools included in the competition reduced kWh consumption during winter break by about 17 percent compared to the preceding three weeks.
A further analysis of five schools reveals that they were successful in turning things off during unoccupied periods during the competition period. As the graph below shows, these schools had significant reductions during each weekend during the competition and for winter break. The well-defined peaks between days 1-5, 8-12 and 15-19 represent occupied weekdays when, consumption would be at its highest. The troughs—day 6-7, 13-14—represent the weekends. The curves flatten out at day 20 with the beginning of winter break and remain low. These curves are exactly what we like to see. See below.

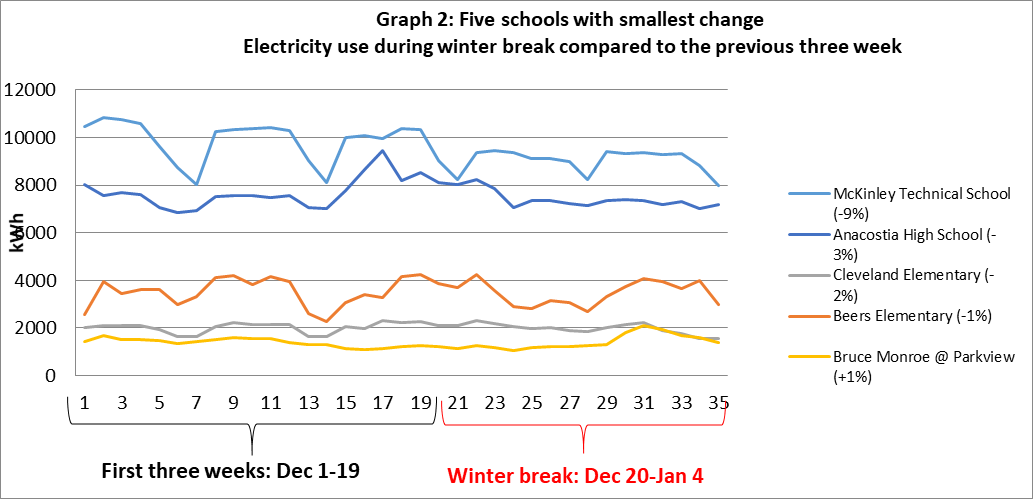
In contrast with the top five schools, the five schools at the bottom of the table were less successful in shutting down over winter break. By looking at the load profiles of these schools and analyzing the data, these buildings are consuming electricity at nearly the same rate during weekends and holidays as they are when the building is fully occupied during the week. This is particularly true for Cleveland and Bruce Monroe @ Parkview, indicated by electricity use curves that are essentially flat with no troughs or peaks.

The take away is a) improving shut down performance during unoccupied times. reductions; and, b) implementing tighter HVAC scheduling on a permanent basis. If the bottom five schools realized electricity reductions over winter break consistent with the competition average—17 percent, the five schools would have reduced their spending by $8,012, or $5,718 above their actual spending.
Making permanent scheduling changes at these five sites presents a significant saving opportunity. A 20 percent reduction would save the city $210,000 per year—or $1 million over five years– in electricity costs. A 10 percent reduction would achieve a savings of $118,965 per year—or nearly $600,000 over five years—across these five facilities.
The 20 percent reduction target is not arbitrary. Implementing scheduling/controls changes at facilities that currently have no or limited schedules in place should yield at least a 20 percent reduction. Annually this would save US taxpayers $2 Billion in utility costs.
Quantifying sustainability added value to the DCPS Modernization Program by drastically decreasing the costs of operating a school. The planning process has been redesigned such that passive design features are now discussed at the outset. The short term cost of implementing these features is justified by the long term savings they yield. Backed with Optimization this is a win win for everyone.
